
A simple Balance Sheet Analytics app offers a quick evaluation of company capital structure. Provides detailed analysis of what the company owns and owes as well as the amount invested by shareholders using directly General Ledger items.
Forget the rigid view of static indicators – direct GL data offers dynamic answering with directly asked questions. In seconds, you can look at the data not only through years, months, year-on-year growth but also through the look of specific cost centers.
All this is just a step away from other key financial statements built on the same accounting data.

No more excel anomalies and data mess
Let you Balance Sheet, PnL, Cash Flow analytics work together!
Content
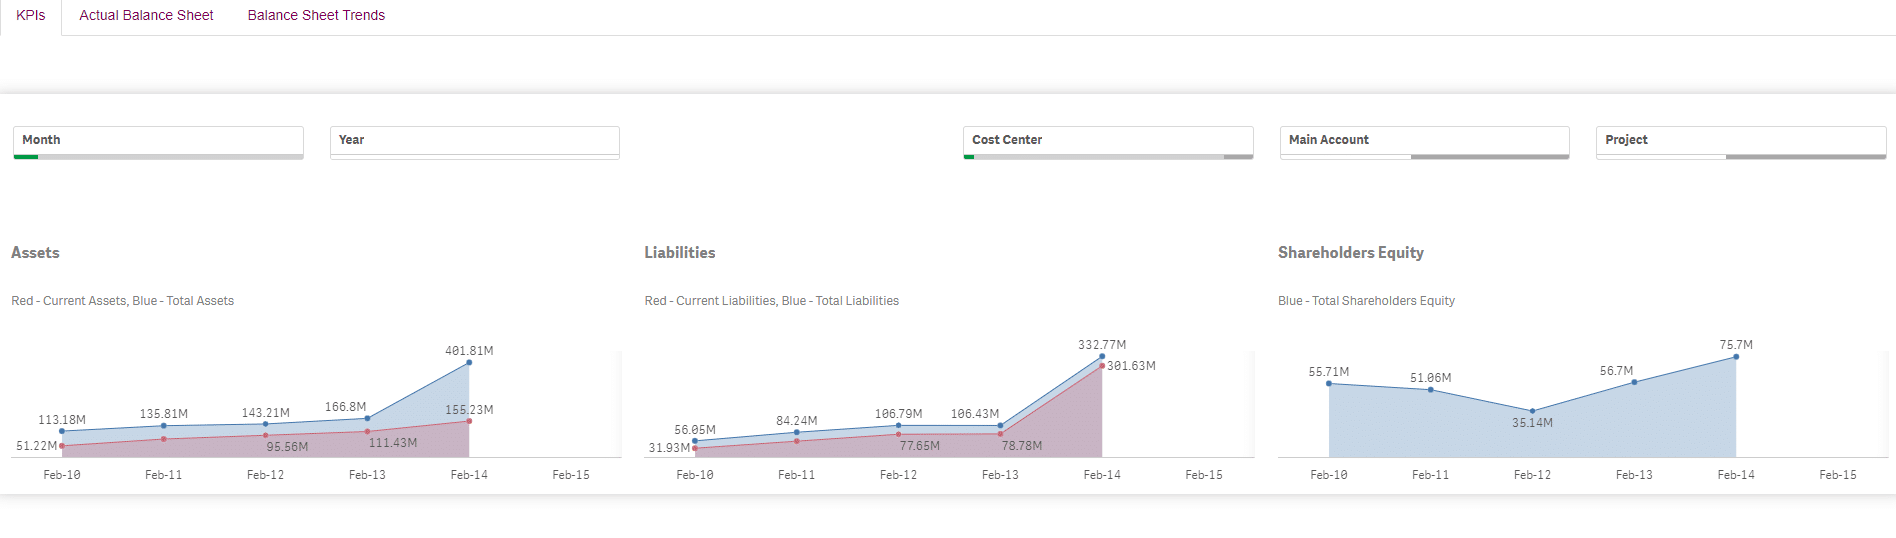
KPIs overview
key capital KPIs and timelines
Actual Drill-Down
calculates detailed accout balance using key KPIs, dimensions, relationships, amd timelines
PLUS create your own sheets and objects for sharing with your team
Measures, Dimensions and KPIs
Basic measures
General Ledger Items Count, Items Amout Sum
Dimensions
Cost Centers, Main/Sub Accounts, Chart of accounts, year, month
Typical Use Cases
KPIs reporting
As a CFO you´re responsible for a regular company health check. Evaluate company structure within a few seconds.
KPIs metrics show account status for Total Assets, Liabilities and Shareholders Equity in the company. Select time range and easily find most interesting changes and anomalies. What´s happened between March 9 and today? Total amount of Assets decreased because of the drop of Current Assets? A similar situation we can see in Liabilities – did company pay short term loan, or is there any other reason? Check the video and find out how easy you can navigate throu Balance Sheet Analytics App.
Ad-Hoc Analysis of Deviations and Anomalies in GL
Which accounts were most affected between March 10, when most of the businesses was put on hold or had to change the business model and today? There is significant decrease between March 10 and the end of the month. In Account details we see the most affected were two accounts – Net Trade Receivable and Accounts Payable. How long does that take you in the system you use? With Balance Sheet Analytics app it is just a matter of seconds – just click on the video to see.
What we found is that anomaly is not caused by the loan, company receive money from customers and use it to pay off its vendors.