Last year (2022) I finally realized a long-term initiative – installing solar photovoltaic panels. ⚡♻. The price was steep, the return on investment would be about 12 years if energy prices increased then shorter of course, and no subsidy was available from the state. However, I still wanted it because I believe in #SustainableTech and that lots of small “drops” will turn into a real impact on tackling climate change.
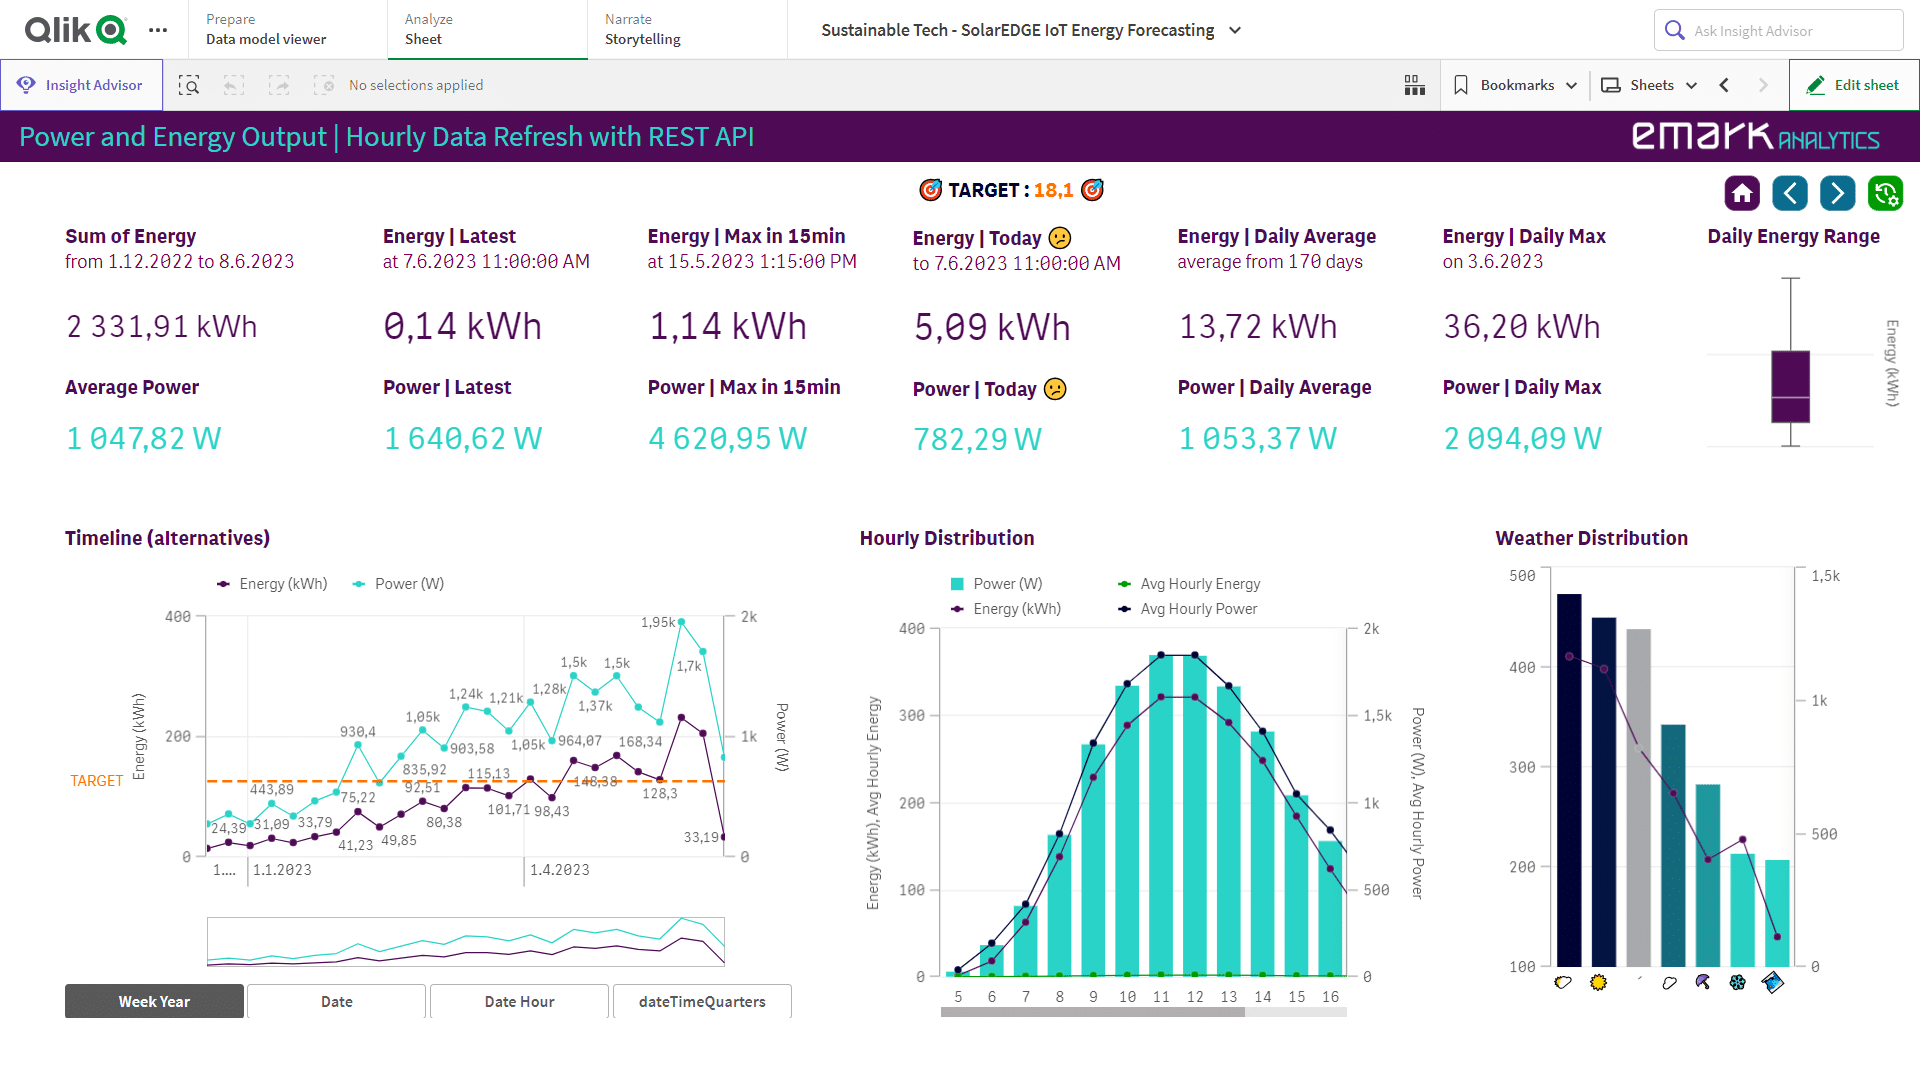
Anyway, the obvious next thing to do was to load the data so I could analyze trends and whether I am on track to achieve the ultimate goal = zero commodity costs, meaning that on average I will consume just “my” energy (utilizing virtual battery).
So far, it looks pretty good, with recent weeks getting to almost 90% of potential power output. I am surprised by how well it performs even when it is cloudy and raining.
Data is loaded with REST API connector and stored in QVD files for a complete history.
Three months later
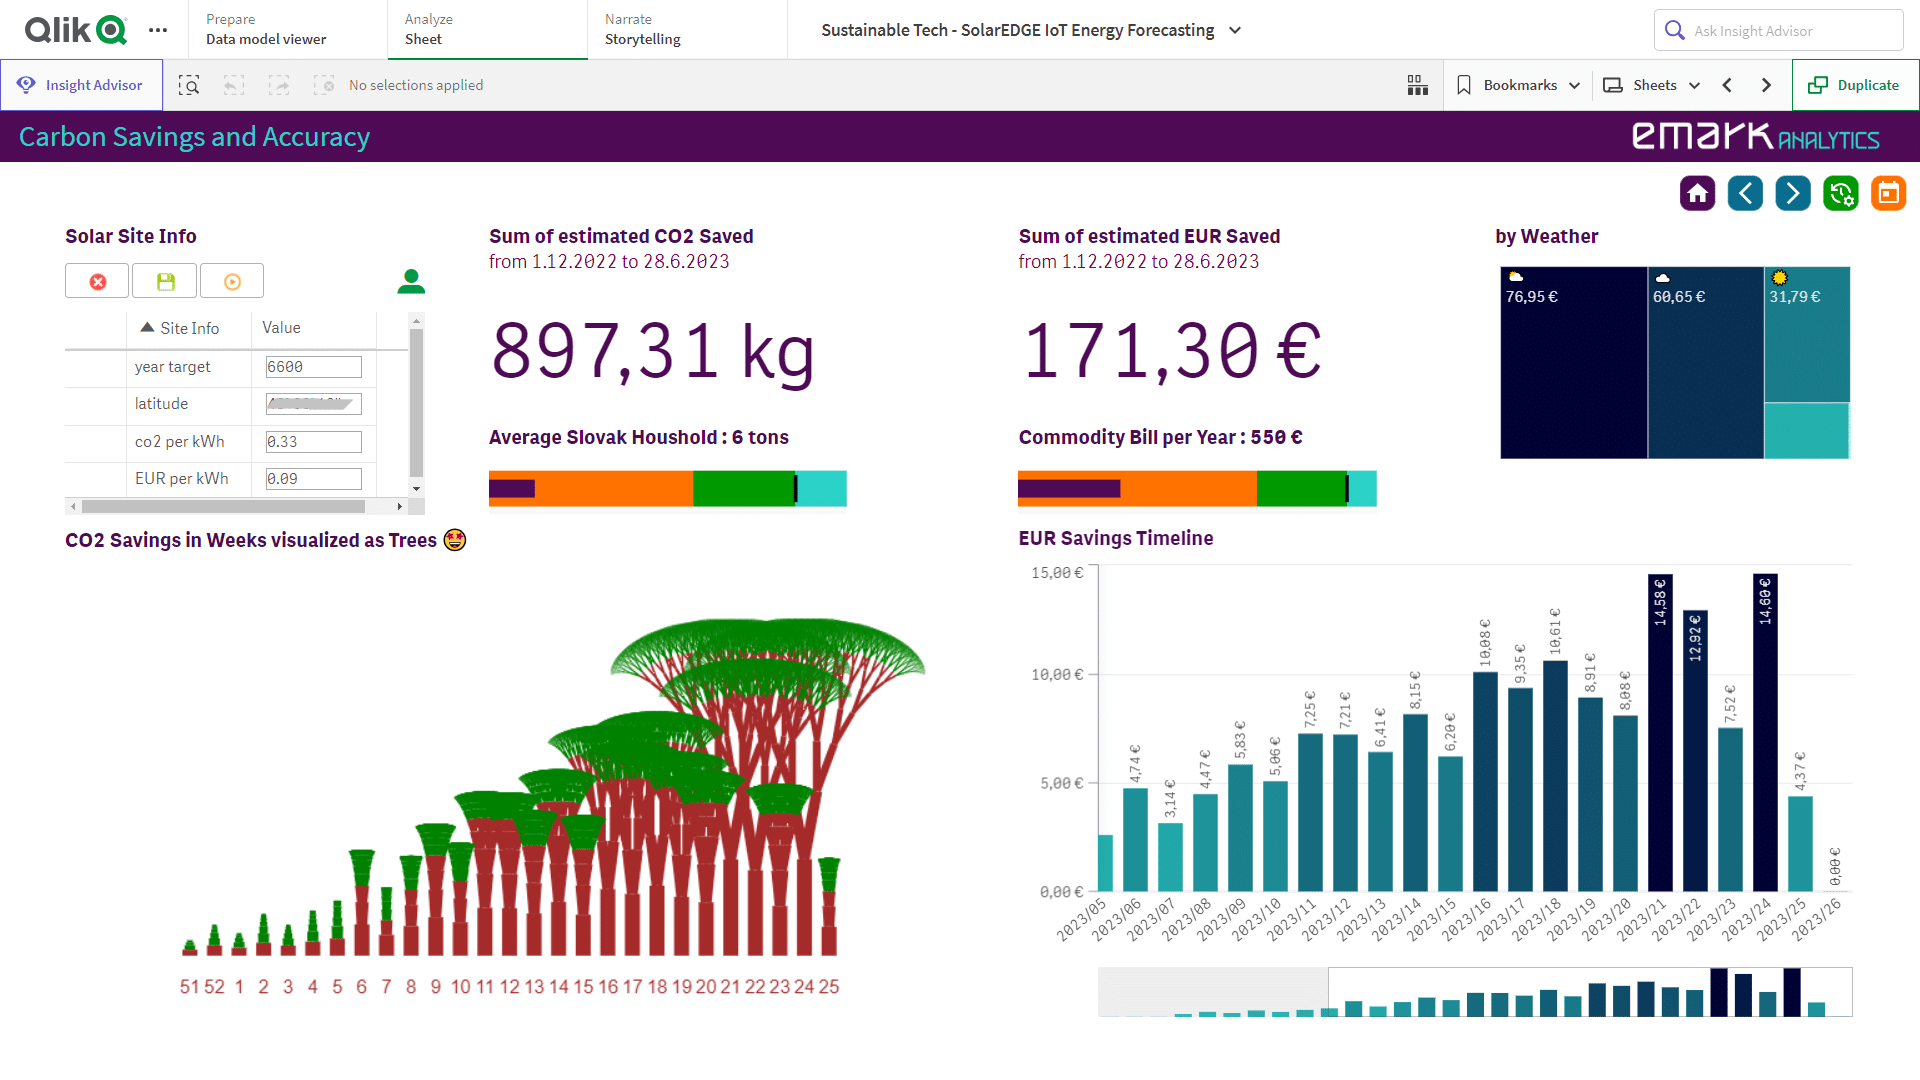
Monitoring the energy output of my PV solar panels is nice and makes me happy when I see it exceeded a daily target. The obvious next step was to translate it into money and CO2 savings. ⚡♻
After digging around for CO2 saving ratios, I settled on a lower estimate that should give me a more realistic view. An average Slovak household produces more than 6 tons per year, which is my target, even though we might be a bit better than average (no gas and almost passive house).
Calculating money savings in time is not as straightforward, so I just assumed a few things for now. After I get a reconciliation invoice from my electricity provider, I will be able to fine-tune it.
Still, a long way to go to meet the goals, but that tree visualization always makes me smile
Thinking about ESG – check how we approach it with our customers.

