Super fast insights
Today, more than ever, you need superfast insights to make fast decisions. Not ready for use in months or years. Ready in days. Everything online.
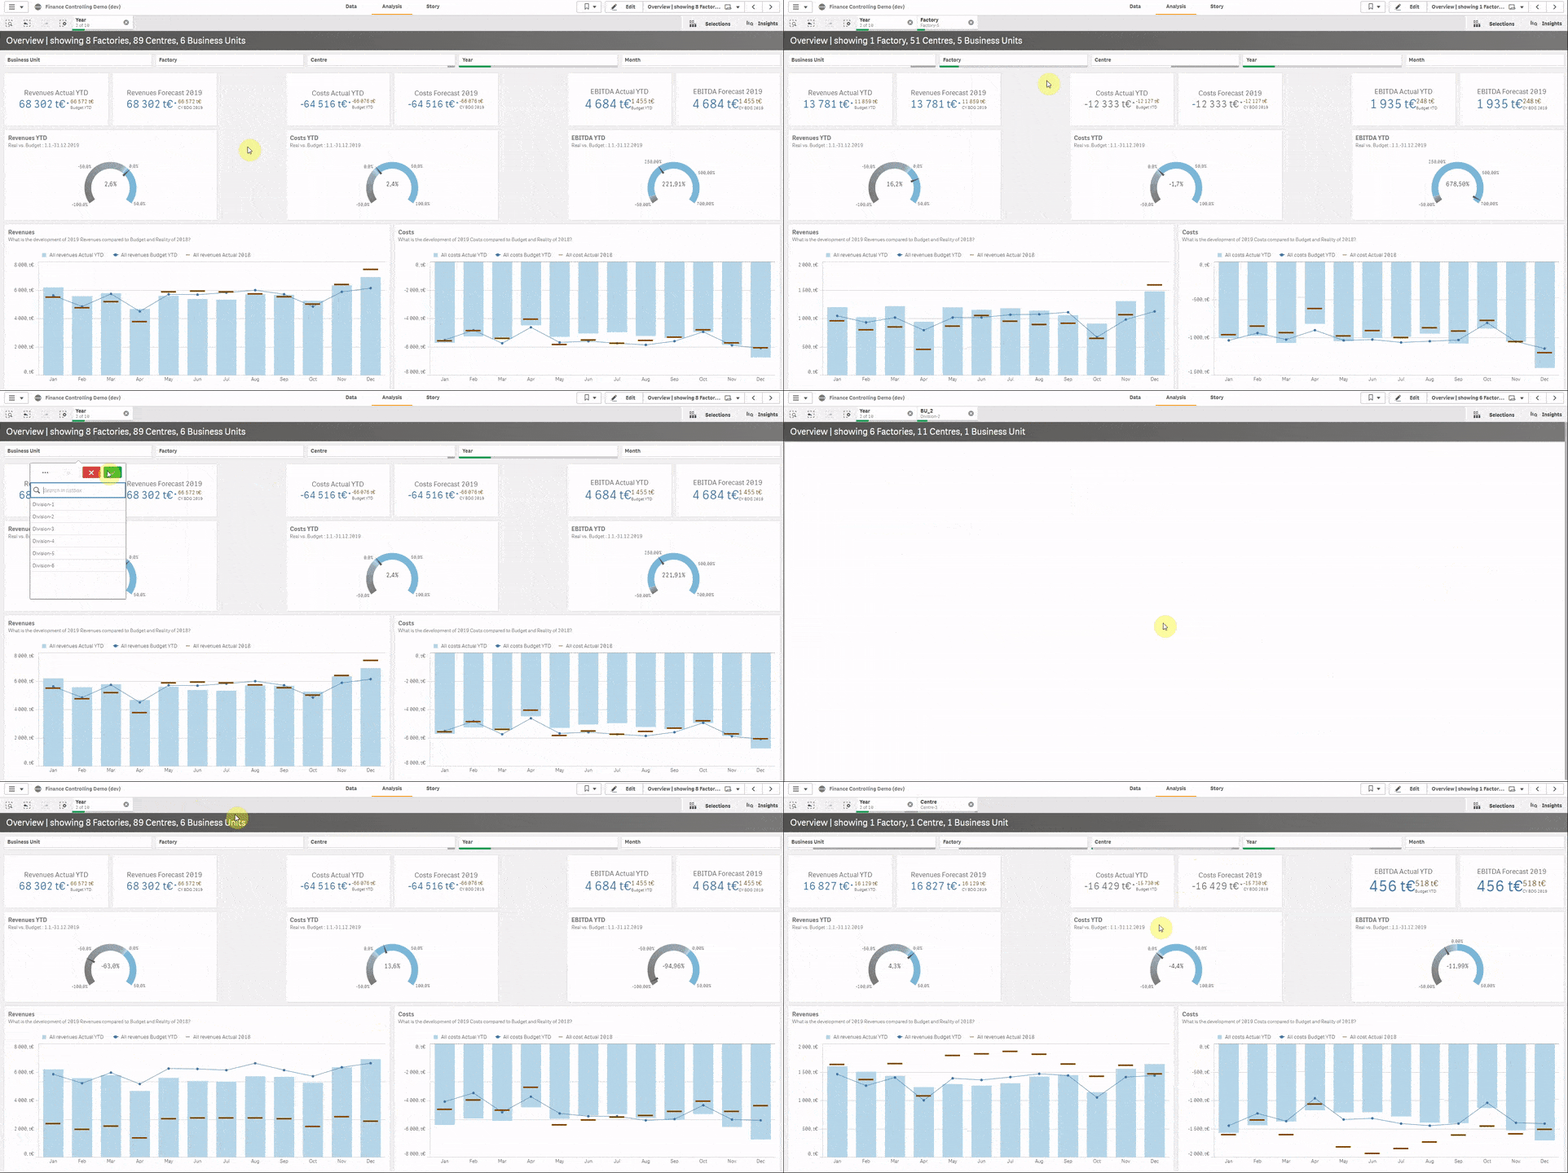
Unlock your data with ready-to-use apps covering all key financial management processes – cash flow, P&L, balance sheet, KPIs including performance management, what-if modeling, planning/forecasting and alerting. With drill-down to any detail. Even beyond accounting.
No lengthy projects with hidden traps. Just a few solid apps to help you understand and make quick decisions.
How?
UNLOCK YOUR DATA
- Connect data from all source systems
- Create associative data model
- Do any ad-hoc self-service analysis in Qlik
GET SUPERFAST INSIGHT
- Ready-made apps & custom dashboards
- Model, plan, set targets & alerts
- Drill-down across all business areas
UNDERSTAND AND ACTION
- Consult with certified financial expert
- Understand what your data tells you
- Set the right strategy & actions
- Monitor key KPIs
What will you get?

Finance planning and analysis
- Reliable and fast analysis of big volumes of data
- Minimizing of spreadsheets and speeding up reporting
- Optimized budget creation and allocation
- Improved financial decisions based on consolidated data
- Blend "top-down" & "bottom-up" forecasting
- Cost reduction and increased revenue

Preparation of financial reports
- Reduce reporting dependency at the end of the month
- Consolidated view of the company's performance and financial position, with the ability to view items in detail
- Smart dashboards: receivables; overdue payables; calculations of reserves or adjustments
- Support of preparation and control of financial statements
- Streamline cash flow and increase asset efficiency
- Integrated treasury functions & visibility

Effectivity and profitability
- Reduced slippage, risks and underperformance
- Eliminate communication lag time
- Increased margins and revenue
- Increase product and market opportunities
- Improved product portfolio performance
- Secured and governed change management during consolidation of reporting

Risk management and compliance
- Simple identification of processes, that compromite the risk models
- Align governance models with strategy
- Transparency of calculations and transformation of data for management and regulators
- Decrease risk, fines, penalties, and fraud
- Improved ad-hoc compliance & risk investigation
- Effective managerial, audit and controlling dashboards

Expense management
- Leverage expense under-runs
- Focus on decisions that make profit or reduce costs
- Real-time management of standard, budgeted, and actual costs
- Thorough evaluation of real TCO
- Deliver month on cost & manage exceeding costs
- Cost reduction and increased profit
Our references








Cashflow Analytics app
We created the Cashflow Analytics app for everyone who lacks analytical intel on in/out-coming cash. The more data (invoices) you throw into it the better projection into the future you’ll have.
Powered by Qlik’s Associative Index, it provides true data discovery, practically infinite number of possible views and “gray” insights – letting you find value in related as well as unrelated data.
The best thing is that this app is ready for yours. You can buy it online and start getting results only minutes from now. If you would like to try it before you buy it, no problem. You can go for a 30-day FREE trial with full functionality. No credit card needed. Click the “Learn more” button for details.
How can this app help your business?
- Identify the impact of overdue ARs on your cashflow
- Review the reliability of your partners in order to reinforce debt collection
- Prepare for cash-out peeks and avoid costly loans
- Get a long-term view of your business to see how stable it is
Profit & Loss Analytics App
Profit & Loss Analytics App summarizes the revenues, costs, and expenses incurred during a specified time period. Provides information about ability (or inability) to generate profit by revenue increment, cost reduction or both and using the power of Qlik offers a level of detail address certain Cost center/Business Unit.
Identify your revenue structure easily and confront it with history and forecasts. Did you plan well or do you have to get better in budget creating?
Everything about General Ledger data saves time and energy to get the context of other financial statements and enables you to spend more time making the decisions than generating valuable insights.
Balance Sheet Analytics app
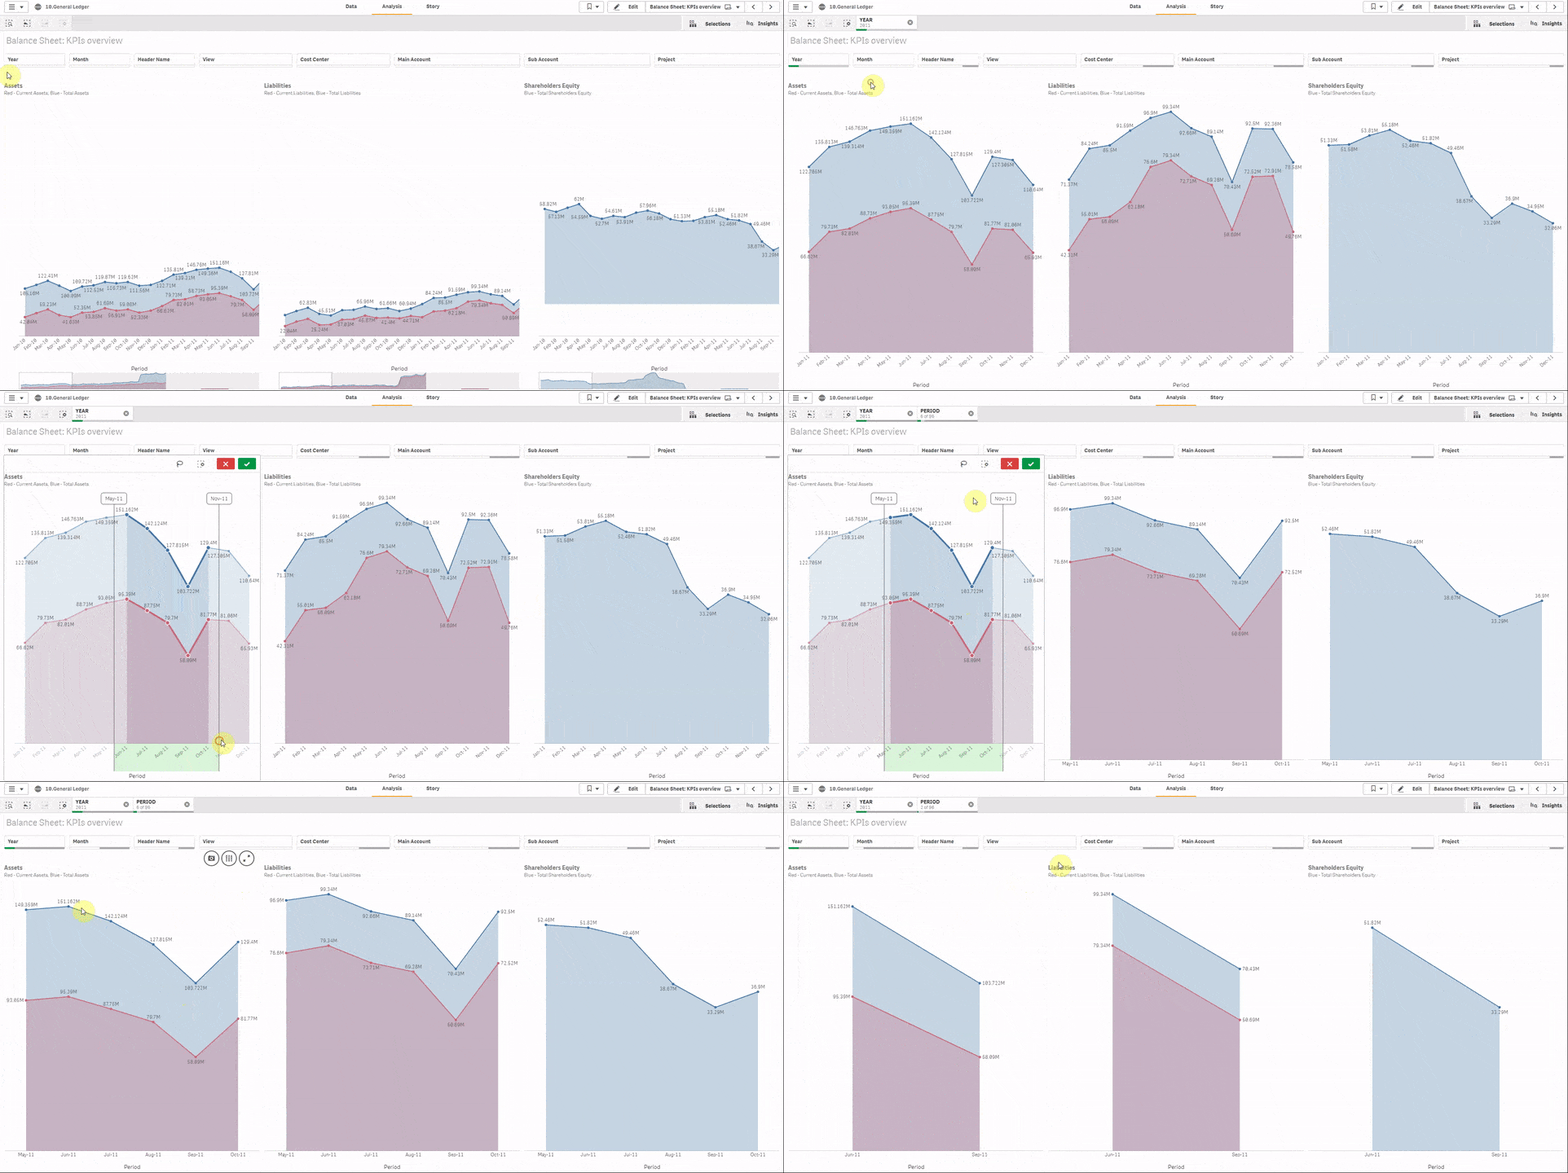
A simple Balance Sheet Analytics app offers a quick evaluation of company capital structure. Provides detailed analysis of what a company owns and owes as well as the amount invested by shareholders using directly General Ledger items.
Forget the rigid view of static indicators – direct GL data offers dynamic answers on any relevant questions you might have. Within seconds you can look at the data not only through years, months, year-to-year growth but also through the look of specific cost centers.
All this is just a simple step away from other key financial statements built on the same accounting data.
No more excel anomalies and data mess – let you Balance Sheet, PnL, Cash Flow analytics work together!
Finance toolkit: Ten powerful finance analytics in one app
This NEW AND IMPROVED Finance Toolkit application gives unparalleled insight to finance and accounting departments. Take action and improve your decision making through multiple financial analysis all within one application including – cash-flow, CAGR, break-even, amortization, forecasting, time value of money, Monte Carlo simulations, and more!
Featured apps:
- Dynamic Actual v. Forecast Expense Analysis
- Expense Details & Ad Hoc
- Financial Reporting
- Forex Translations
- Cash Flow Valuation/IRR
- Compound annual Growth Rate
- Amortization Forecasting, Time Value of Money
- Break-Even Analysis
- Option Valuation & Greeks
- Simulation
- Compounding Interest – Opportunity Cost of 3 € cup of coffee
Go beyond insights to decisions and actions
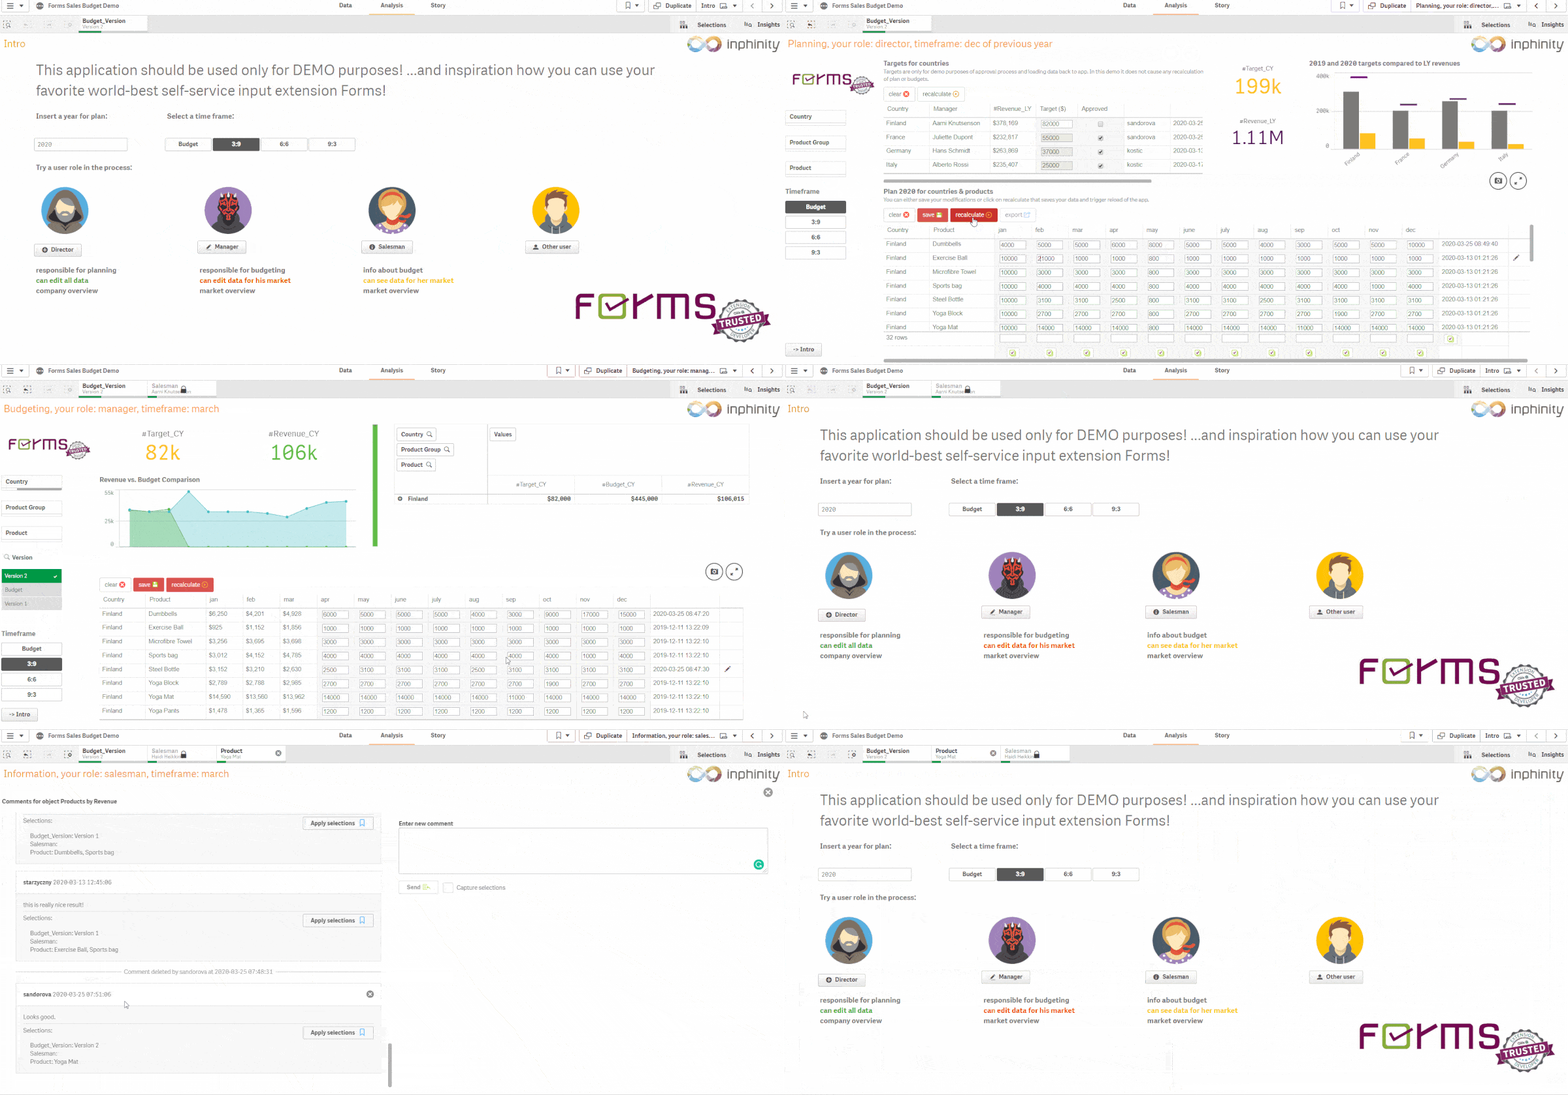
When a solid data analytics merges with flexible write-back / data input, you’ll take controlling and performance management to a higher level. All your analytics and insights can seamlessly translate to business decisions and actions with comments, what-if scenarios, workflows, action plans and more.
Seamless write-back extension for Qlik platform
FORMS is a TED certified extension for Qlik, as well as a standalone web-based data input platform. It can be adjusted to any data write-back or collaboration scenario. Some of FORMS’ key features are:
- Seamless Qlik self-service user experience
- Unlimited number of use-cases and ways to design the data input flow
- Enterprise level security and even offline use
- Open developer API
- Complete activity logging and audit trail
Not sure yet? Check out some case studies
Business Transformation through Financial Analytics:
8 Stories of Success
Deeper visibility into balance sheets. Optimized forecasting. Tighter expense management. A better cash-conversion cycle. More profitable decisions. And more informed calculations about risk. Modern financial analytics comes with a long list of promises – but what do real-world results actually look like? And how can your organization expect to benefit?
10 Ways to Drive Transformation with Modern Financial Analytics
Finance isn’t just a business function anymore. You’re leading the charge. CFOs & Controlling are tasked with launching the business ahead with data-based insights. Finance is expected to be the “analytics powerhouse” of the organization. And finance and accounting departments are under pressure to set aside the old ways of reporting and find new approaches—and new opportunities.

