Find out more about Qlik Sense and R project and learn something about history. Instead of laborious background research of all the US president’s speeches, you can try our mashup called Analysis of Presidential Speeches and do not hesitate to click in graphs, move sliders and do your own selections. Ask questions and get the answers right away. For the purpose of this blog, I chose two most recent presidents for a quick analysis. However, you can play with the app and come up with your own findings. At this moment app offers the best experience on Google Chrome.
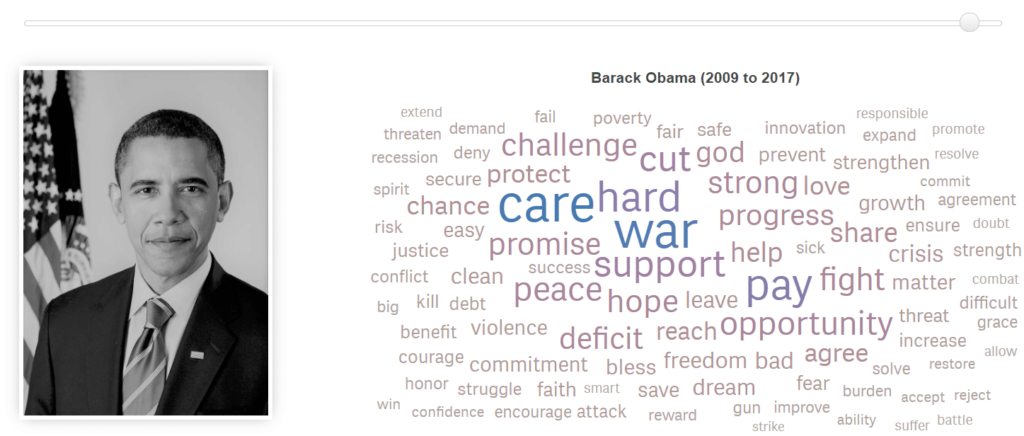
Which words carrying positive or negative sentiment were mostly used by Barack Obama?
Move the slider one step back and see.
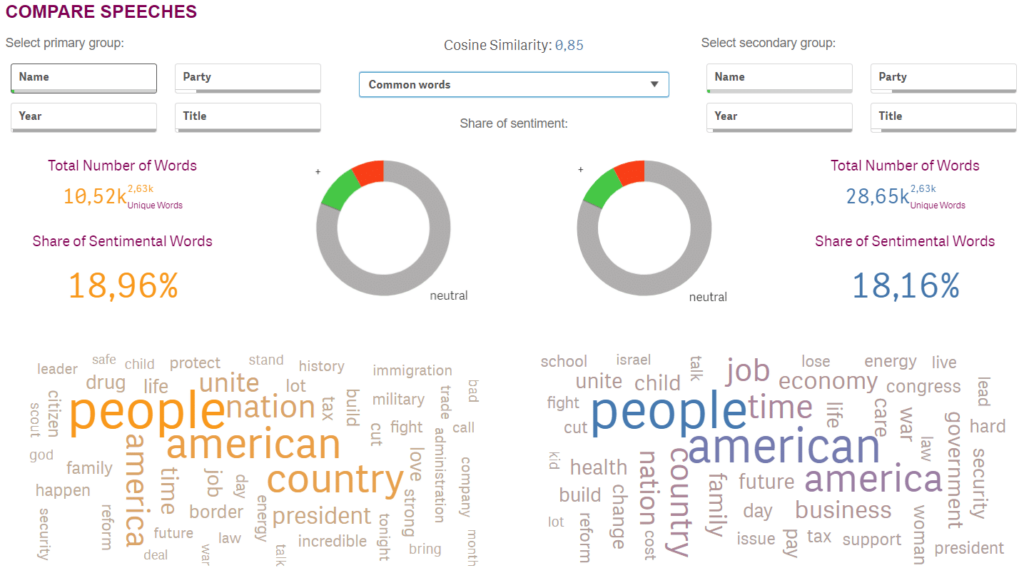
Which words were used by both Donald Trump and Barack Obama?
Click on Name button in COMPARE SPEECHES section and select one president for the primary group on the left and second president in a secondary group on the right. Then choose Common words instead of All words right under Cosine Similarity.
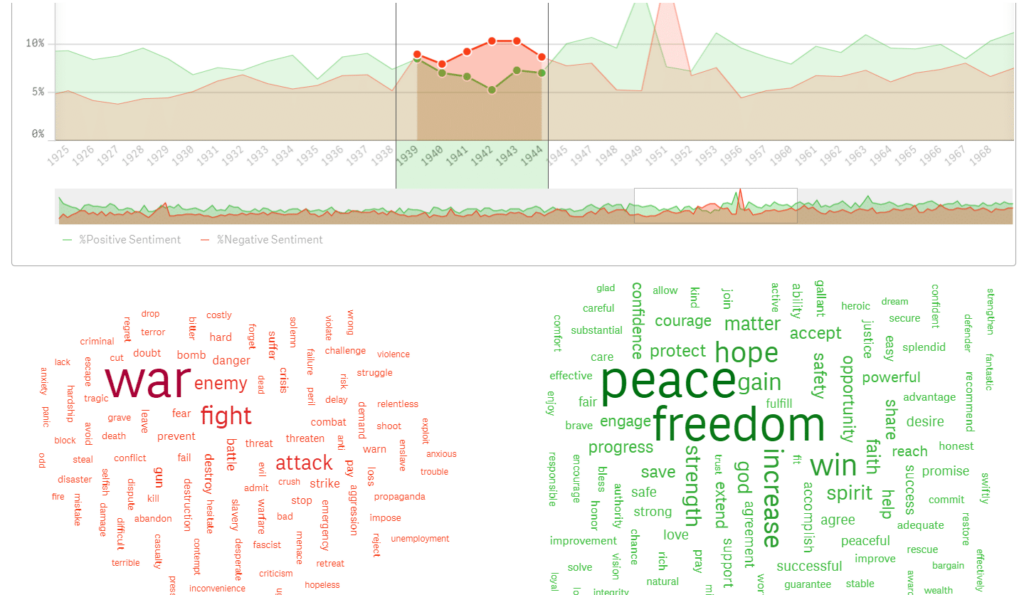
Were there times when words with negative sentiment overtook words with a positive sentiment?
The times were dark around World War II. Select a period on X-axis and see what the words with negative and positive sentiment were:
Clear all selections using buttons on the top and start again or move back and forth or combine selections to get new views on the data. The possibilities are endless.
The story behind
I started working in Emark with zero experience in Qlik Sense, therefore, I needed to learn. I needed to learn a lot. What is the most fun way to do that? It is not watching endless videos and reading books full of abstract terms. At least not for me. I had to apply what I learned. That is why I decided to assign little projects for myself to practice and this is one of them.
You can do more with Qlik
If you want to extend Qlik capabilities and use more advanced statistical tools, R or Python are good choices. Both languages can be integrated with Qlik, which means that you can send lines of code directly from Qlik and receive the results immediately. You need to handle SSEPlugin and Rserve package, but I will save this one for another time.
In this case, I took a little bit of R (for text processing) and a handful of Qlik Sense (for powerful interactive visualizations) and blended it all together in a big bowl of the mashup, and voila!
To be more technical
Text mining techniques were implemented to get useful information from transcriptions which were obtained from The Grammar Lab and Miller Center. This is how you prepare data:
- Split texts into small entities, in this case, words (tm package is a great help with this one)
- Filter out words with no information value (stop words, numbers, special characters, etc.)
- Try to get the base form of a word using word stemming and word lemmatization (check out textstem package). You want to have „connect“ instead of „connection“, „connected“, „connecting“. Remember, you are trying to simplify the information.
- Assign positive, negative or neutral sentiment to words (afinn lexicon from tidytext package was used for that one).
When the data is prepared the easier part follows – load data and create visualizations using Qlik Sense.
And there you have it. A nice tool to get your own insights without limitations of passive charts, numbers, and tables. Now it is up to you. Get your own insights, share them and let us know what you think.
Find the app HERE: https://qap.emarkanalytics.com/extensions/Emark_PresidentialSpeeches/Emark_PresidentialSpeeches.html


