

Machine learning-based forecasting is usually not a native part of BI tools. In contrast, open-source programming languages such as R
and Python
, which are often used for machine learning, are ideal candidates. Their support for matrix calculations and the large number of packages focused on machine learning, statistics, and optimization tasks make them perfectly suited for these kinds of assignments. However, the advantages brought by R/Python should certainly not be reserved only for data science specialists. BI tools and data science should complement each other. If we establish communication between BI tools and R/Python, we gain two major benefits:
- BI tool users will be able to make decisions based on models created by data science specialists
- Users will be able to utilize advanced statistical and optimization methods without having to know the syntax of R or Python (for example, sales forecasting).
Data science in Qlik
In the case of Qlik, communication with external computational languages is handled through so-called [Server Side Extension](https://github.com/qlik-oss/server-side-extension?utm_source=chatgpt.com) (SSE). Simply put:
- Qlik prepares the required data and sends it to R/Python
- The calculations are performed in R/Python (model estimation, model outputs, forecasts, etc.)
- R/Python sends the data back to Qlik, which then visualizes it.
There are several ways to trigger this communication:
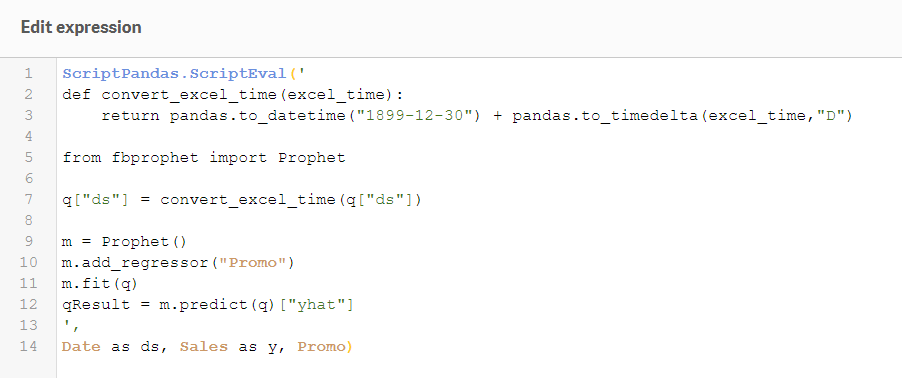
- In the Qlik data load editor (where you write Qlik scripts), you write an R/Python script and specify which data should be sent from Qlik. After the application reload runs, the R/Python script is evaluated and returns a new table back to Qlik.
- Directly in the application, it is possible to define a new metric that will be calculated externally in R/Python based on data sent from Qlik
- By defining a new function that behaves like a native Qlik function, but whose calculation is performed externally in R/Python. Such a function can then be called directly in the application as a metric or in a Qlik script
It is exactly this last approach that Nabeel Asif used to create the SSE plug-in [PyTools](https://github.com/nabeel-oz/qlik-py-tools?utm_source=chatgpt.com). It is essentially a collection of Python functions for machine learning that can be called from Qlik (instructions on how to install PyTools can be found [here](https://github.com/nabeel-oz/qlik-py-tools?utm_source=chatgpt.com#pre-requisites)). It also includes functions for the Prophet tool — which we already used in the previous article.
Retail company sales forecasting
Let’s return to the previous example. A company with a network of retail stores needs to forecast future sales on specific days. In this article, we will not go deeply into how the process of building and testing a forecasting model should properly look, but rather demonstrate how easy it is to call such a predefined function directly from a Qlik application.
Prophet has several great features. One of them is that it automatically detects and calculates seasonality. If we send historical sales data from Qlik, it automatically creates yearly and weekly seasonal components. Based solely on this time series, we can easily obtain a fairly good forecast. For our purposes, we will additionally include information about which days have promotional campaigns.
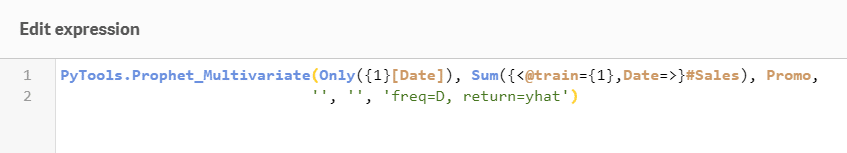
We then simply add a new metric to the predefined line chart: PyTools.Prophet_Multivariate([Date], Sum(#Sales), Promo, ”, ”, ‘freq=D’). Essentially, we are just calling the function Prophet_Multivariate from the SSE plug-in PyTools and sending data from Qlik: Date, #Sales, Promo. The parameter ‘freq=D’ specifies that we want to create a forecast with daily frequency, while the empty quotation marks are placeholders where additional optional parameters could be added. The result:
Let us briefly return to the options for triggering external calculations in R or Python. A major advantage of Qlik – R/Python communication via SSE is that when a function or script is called from the Qlik application, the calculation happens at that exact moment. In other words, the Qlik application sends to R/Python only the data that you currently have filtered. To create forecasts for individual stores, we therefore only need to filter those stores. In the following image, we can see how the new calculation is recalculated instantly when filters are applied. In the case of more demanding calculations, it is good to keep this in mind and pre-calculate the results during the Qlik application reload.
I hope I have sparked your interest in pushing the boundaries of analytics in Qlik Sense. If forecasting as a topic interests you or if you have any questions, feel free to contact me.
I would appreciate any comments, suggestions, or inspiration either in the comments or via email at juracek@emarkanalytics.com
.


